What is a Decision Support System (DSS)

  • A specific class of computerized information system that supports organizational decision-making activities.
  • An interactive software-based system intended to help decision-makers compile useful information from raw data, documents, expertise knowledge, and/or scientific models to identify and solve problems and make decisions

Decision Support System (DSS)

We designed a decision-support system (DSS) for risk assessment and management of forest invasive species (FIS). It combines several models (invasion, forest, mitigation and valuation) that allow to simulate an invasion process, its effects on forest ecosystems, and possible economic impacts. The DSS is developed in an R environment and designed as an interactive Shiny-based Web App, accessible from a web browser, thus no software installation is required.

The front-end web interface allows the user to run different invasion and mitigation scenarios, display graphical outputs (e.g., maps and charts) and download results (Figure 1). First, the end-user can use drop-down menus to select the invasive species of interest and the desired climate change scenario (which will define which climatic suitability maps will be used – see below). The user can further refine scenarios by modifying parameters related to the invasion process (e.g., number and frequency of invasion events, dispersal distance, impact rates), to mitigation actions (e.g., intensity, costs and efficiency) and to economic assessment (e.g., timber prices). It should be noted that some parameters can be informed by genomics, for example flight capacity or cold tolerance. Typically, new scenarios can be run following a FIS detection and its analysis with genomic tools. This allows to assess potential economic impacts under a given invasion scenario, as well as to analyze tradeoffs between mitigation costs and potential impacts.

We present here an example of output from the DSS prototype developed for a severe invasion in south-western British Columbia (Figure 1). Following the introduction and detection of some FIS specimens in Vancouver, it allows to simulate the potential consequences of a further introduction to the neighbouring forest. It simulates the spread in the forest landscape, simulate impacts (tree mortality), assess the potential economic consequences (e.g., disruption of the timber supply flow) and estimate the cost of different mitigation scenarios.


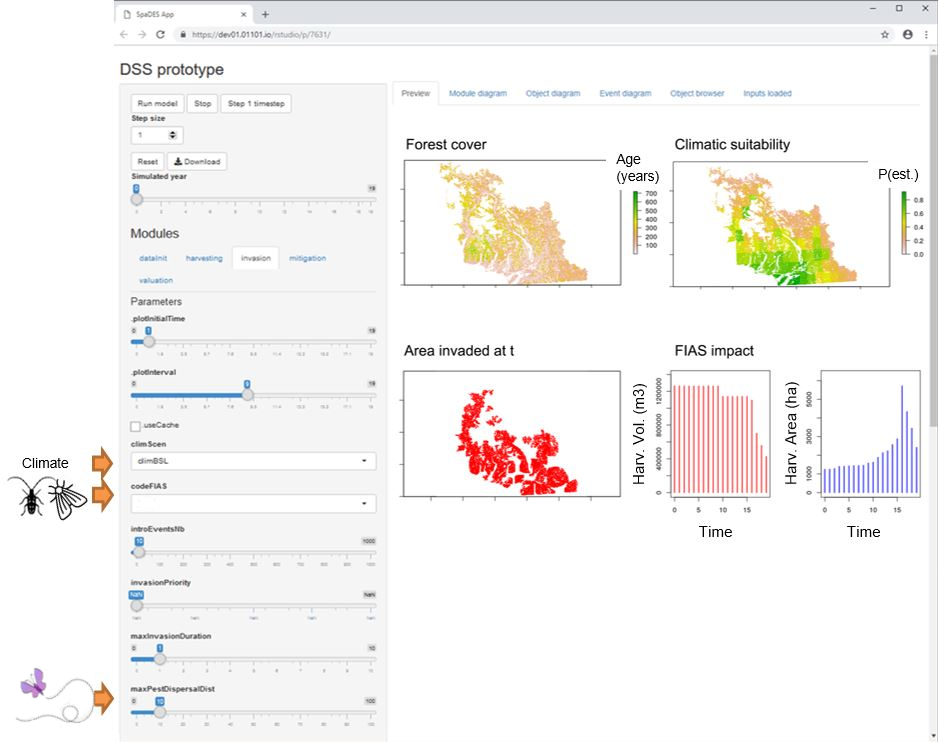
Figure 1. User front-end of the DSS prototype, highlighting some of the main end-user input parameters controlling the invasion process (climate scenario, species selection, maximal dispersal distance) and displaying example results for a severe FIS invasion in south-western BC. Figure prepared by Valentine Lafond.

Climatic suitability maps

One of the main inputs of the decision support system are climatic suitability maps for FIS of interest under current and future climatic conditions (Figures 2 and 3). Those maps are outputs of species distribution models (SDM) built using a correlative approach to relate FIS occurrence data (from native and invaded ranges) to climatic variables (19 bioclimatic variables from WorldClim). This approach allowed to characterize the ecological niche of the four FIS of interest (AGM, ALB, SOD, DED) and to project suitable habitat under current and future climatic conditions. For the latter, we used three representative concentration pathways (RCPs) from the IPCC (RCP 2.6, 4.5, and 8.5) and three general circulation models (GCMs: CCSM4, HadGEM2-ES and MIROC5), resulting in nine different scenarios. Future climatic suitability are provided thereby provided for one future climate change scenario only (CCSM4-RCP 8.5).


Figure 2. Climatic suitability maps under current (left) and future (right) climatic conditions for the Asian gypsy moth (AGM; top) and the Asian longhorned beetle (ALB; bottom). Note that future climatic suitability is shown for one climate change scenario only (CCSM4-RCP8.5).


Figure 3. Climatic suitability maps under current (left) and future (right) climatic conditions for the Dutch elm disease (DED; top) and the sudden oak death (SOD; bottom). Note that future climatic suitability is shown for one climate change scenario only (CCSM4-RCP8.5).

Low-cost urban tree inventory in urban areas

Urban forests are gaining global attention as evidence is gathered about the diverse benefits they provide to human health and well-being through various ecosystem services. Planning and managing urban forests and trees on the basis of urban tree inventories is increasingly coming to the fore in the context of global urbanization trends, rapid climate change and increasingly connected trade. Nevertheless, urban forest planning and management remains an outstanding challenge worldwide owing to relatively scarce information on the spatial distribution and accessibility of urban forests and trees, as well as their health condition, composition, structure and function. In practice, most municipalities still perform labor-intensive field surveys to collect and update inventories of public trees. Despite the importance of urban trees, national and municaipal sources of tree inventory lack in detail, consistency and quantity due to the cost associated with mapping and monitoring trees through time and over large areas.

The study aims to produce an automatic, affordable and novel method for tree detection and geolocation that can be used in any urban region where sufficient street-level imagery is readily available. I introduce state-of-the-art instance segmentation (object detection and pixel masking) with DL frameworks to extract and mask fuzzy features like trees in images (s. section 2.2.4 and appendix B.2.1). In addition, the novelty of this method is enhanced by using monocular depth estimation and triangulation to estimate precise tree locations without the need to rely on secondary datasets. [Introduction excerpt from Stefanie Lumnitz MSc Thesis 2019]

Visit the Webinars page to view Stefanie Lumnitz's live presentation on this study.

Click here for the course code to run this type of analysis.


Detection + Geolocation of urban trees using monocular depth estimation from single street-level images.


Classification: Using street images to automate street tree species identification - RESULTS

Mean average precision of 83% and top 3 accuracy of 95%
The model can classify 27 genera with an accuracy over 0.7


Valuing urban trees

Under construction...

Risk assessment and management of forest invasive species

Under construction...

What's new
in the bioSAFE project